Abacos Bahamas

Abaco Weather

Average Weather for Abacos (Green Turtle Cay)

JanFebMarAprMayJunJulAugSepOctNovDec
Mean Daily Maximum Temperature - F°
757880808588898888868380
Mean Daily Minimum Temperature - F°
636766707376777576747171
Monthly Rainfall - Inches
6.36.62.81.5115.64.67.45.42.76.84.6
Number of Rain Days
8755111391316695

Abaco Tide Tables

Green Turtle Cay, Abacos, Bahamas Weather Forecast

The AccuWeather.com RSS Center
To discover additional weather feeds, visit the AccuWeather.com RSS Center at https://corporate.accuweather.com/resources/downloads

10/8/2025 Forecast
High: 86 F Low: 75 F A shower and t-storm; windy

10/9/2025 Forecast
High: 84 F Low: 75 F A couple of thunderstorms

Whitesound, Elbow Cay, Bahamas Weather Forecast

Intellicast Atlantic Weather Radar Map - Hi Res Loop

Intellicast Caribbean Weather Radar Map - Hi Res Loop

Eleuthera Weather Forecast

Melbourne Florida Radar Map

NASA's Hurricane Resource Page

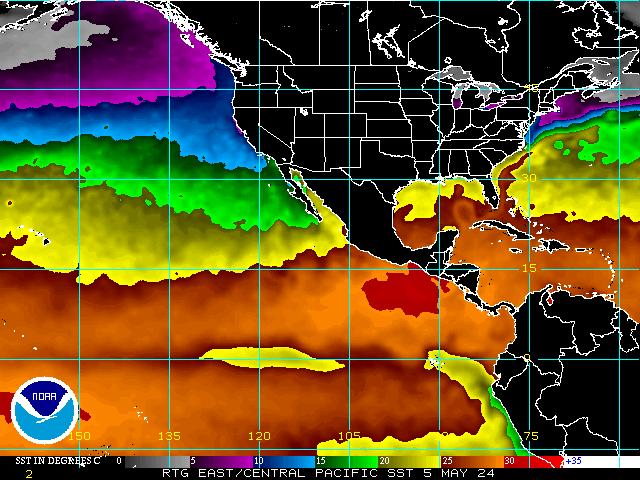
Sea Surface Temperatures (expressed in Celcius degrees)

Space, Science & Engineering's Interactive Geostationary Real Time Satellite Images

NHC Atlantic

Active tropical cyclones in the Atlantic, Caribbean, and the Gulf of America

Local Statement for Tallahassee, FL

Issued at 804 PM EDT

Posted on 31 December 1969 | 6:00 pm

Local Statement for New Orleans/Baton Rouge, LA

Issued at 721 PM CDT

Posted on 31 December 1969 | 6:00 pm

Local Statement for Mobile, AL/Pensacola, FL

Issued at 705 PM CDT

Posted on 31 December 1969 | 6:00 pm

Tropical Storm Bertha Graphics


Tropical Storm Bertha 34-Knot Wind Speed Probabilities
Wind Speed Probabilities last updated Mon, 20 Jul 2026 21:22:32 GMT

Posted on 20 July 2026 | 7:04 pm

Tropical Storm Bertha Storm Surge Watch/Warning Map

Tropical Storm Bertha Link to Storm Surge Watch/Warning Map
Storm Surge Watch/Warning Map last updated Mon, 20 Jul 2026 23:57:42 GMT

Posted on 20 July 2026 | 6:57 pm

Atlantic Tropical Weather Outlook

495
ABNT20 KNHC 202357
TWOAT

Tropical Weather Outlook
NWS National Hurricane Center Miami FL
800 PM EDT Mon Jul 20 2026

For the North Atlantic...Caribbean Sea and the Gulf of America:

Active Systems:
The National Hurricane Center is issuing advisories on recently
upgraded Tropical Storm Bertha, located over the northeastern Gulf
of America.

Tropical cyclone formation is not expected during the next 7 days.

$$
Forecaster Hagen

Posted on 20 July 2026 | 6:57 pm

Tropical Storm Bertha Public Advisory Number 6a

Issued at 700 PM CDT Mon Jul 20 2026

000
WTNT32 KNHC 202351
TCPAT2
 
BULLETIN
Tropical Storm Bertha Intermediate Advisory Number 6A
NWS National Hurricane Center Miami FL       AL022026
700 PM CDT Mon Jul 20 2026
 
...NOAA HURRICANE HUNTERS FIND THAT THE DEPRESSION HAS STRENGTHENED 
INTO TROPICAL STORM BERTHA...
 
 
SUMMARY OF 700 PM CDT...0000 UTC...INFORMATION
----------------------------------------------
LOCATION...28.6N 86.0W
ABOUT 110 MI...180 KM S OF PANAMA CITY FLORIDA
ABOUT 190 MI...310 KM SE OF MOBILE ALABAMA
MAXIMUM SUSTAINED WINDS...40 MPH...65 KM/H
PRESENT MOVEMENT...WNW OR 300 DEGREES AT 3 MPH...6 KM/H
MINIMUM CENTRAL PRESSURE...1004 MB...29.65 INCHES
 
 
WATCHES AND WARNINGS
--------------------
CHANGES WITH THIS ADVISORY:
 
None.
 
SUMMARY OF WATCHES AND WARNINGS IN EFFECT:
 
A Storm Surge Watch is in effect for...
*  Alabama/Florida Border to the Mouth of the Mississippi River
 
A Tropical Storm Watch is in effect for...
* Ochlockonee River Florida westward to the Jefferson/Plaquemines
Parish border in Louisiana.
 
A Storm Surge Watch means there is a possibility of life-
threatening inundation, from rising water moving inland from the
coastline, in the indicated locations during the next 48 hours.
For a depiction of areas at risk, please see the National Weather
Service Storm Surge Watch/Warning Graphic, available at
hurricanes.gov.
 
A Tropical Storm Watch means that tropical storm conditions are
possible within the watch area, in this case in the next 24 to 48
hours.
 
Additional watches or warnings may be required tonight or on
Tuesday.
 
For storm information specific to your area, including possible
inland watches and warnings, please monitor products issued by your
local National Weather Service forecast office.
 
 
DISCUSSION AND OUTLOOK
----------------------
At 700 PM CDT (0000 UTC), the center of Tropical Storm Bertha was
located near latitude 28.6 North, longitude 86.0 West.  Bertha has 
been drifting erratically near 3 mph (6 km/h), but a northwestward 
motion is expected tonight and Tuesday morning, followed by a 
west-northwestward or westward motion.  On the forecast track, 
Bertha will move near or along the northern Gulf coast during the 
next several days.
 
Maximum sustained winds have increased to near 40 mph (65 km/h) 
with higher gusts.  Some additional strengthening is possible 
during the next day or so.

Tropical-storm-force winds extend outward up to 70 miles (110 km) 
from the center.
 
The minimum central pressure reported by a NOAA Hurricane Hunter 
aircraft is 1004 mb (29.65 inches).
 
 
HAZARDS AFFECTING LAND
----------------------
Key messages for Tropical Storm Bertha can be found in the Tropical 
Cyclone Discussion under AWIPS header MIATCDAT2 and WMO header 
WTNT42 KNHC.
 
WIND:  Tropical storm conditions are possible within the watch
area in the Florida Panhandle by late tonight into Tuesday. Tropical
storm conditions are possible within the remainder of the watch
area by late Tuesday night into Wednesday.
 
STORM SURGE:  The combination of storm surge and the tide will
cause normally dry areas near the immediate coast to be flooded by
rising waters moving inland from the shoreline.  The water could
reach the following heights above ground somewhere in the indicated
areas if the peak surge occurs at the time of high tide...
 
Mouth of the Mississippi River, LA to AL/FL Border...2-4 ft
Indian Pass, FL to Chassahowitzka, FL...1-3 ft
Morgan City, LA to Mouth of the Mississippi River, LA...1-3 ft
Lake Pontchartrain...1-3 ft
 
The deepest water will occur along the immediate coast.
Surge-related flooding depends on the relative timing of the surge
and the tidal cycle, and can vary greatly over short distances.  For
information specific to your area, please see products issued by
your local National Weather Service forecast office.
 
For a complete depiction of areas at risk of storm surge
inundation, please see the National Weather Service Peak
Storm Surge Graphic, available at
hurricanes.gov/graphics_at2.shtml?peakSurge.
 
RAINFALL: Bertha is expected to produce rainfall amounts of 2 to 4 
inches with isolated higher totals around 8 inches through Friday 
along the Gulf Coast and adjacent inland locations from western 
Florida to the Middle Texas Coast, including southern portions of 
Alabama, Mississippi, and Louisiana. This rainfall may produce areas 
of flash flooding, especially in urban areas.
 
For a complete depiction of forecast rainfall associated with
Bertha, please see the National Weather Service Storm Total Rainfall 
Graphic available at hurricanes.gov/graphics_at2.shtml?rainqpf and 
the Flash Flood Risk graphic at 
hurricanes.gov/graphics_at2.shtml?ero.
 
TORNADOES: An isolated tornado or two is possible over the Florida
Big Bend region this evening.
 
SURF:  Swells generated by Bertha are affecting portions of the 
Gulf coast of Florida and are likely to spread westward during
the week.  These swells are likely to cause life-threatening surf
and rip current conditions.  Please consult products from your
local weather office.
 
A depiction of rip current risk for the United States can be found
at: hurricanes.gov/graphics_at2.shtml?ripCurrents
 
 
NEXT ADVISORY
-------------
Next complete advisory at 1000 PM CDT.
 
$$
Forecaster Pasch

Posted on 20 July 2026 | 6:51 pm

Summary for Tropical Storm Bertha (AT2/AL022026)

...NOAA HURRICANE HUNTERS FIND THAT THE DEPRESSION HAS STRENGTHENED INTO TROPICAL STORM BERTHA... As of 7:00 PM CDT Mon Jul 20 the center of Bertha was located near 28.6, -86.0 with movement WNW at 3 mph. The minimum central pressure was 1004 mb with maximum sustained winds of about 40 mph.

Posted on 20 July 2026 | 6:51 pm

Tropical Storm Bertha Potential Storm Surge Flooding Map


Potential Storm Surge Flooding Map last updated Mon, 20 Jul 2026 21:51:23 GMT

Posted on 20 July 2026 | 4:51 pm

Tropical Depression Two Forecast Discussion Number 6

Issued at 400 PM CDT Mon Jul 20 2026

200 
WTNT42 KNHC 202048
TCDAT2
 
Tropical Depression Two Discussion Number   6
NWS National Hurricane Center Miami FL       AL022026
400 PM CDT Mon Jul 20 2026
 
The earlier aircraft mission into the depression found a minimum 
central pressure of 1005 mb and maximum flight-level winds of 34 
kt. ASCAT data from the western part of the circulation showed 
winds below 35 kt, and the latest satellite intensity estimate from 
TAFB was 30 kt.  Based on these, the depression has not yet reached 
tropical-storm strength and the initial intensity is held at 30 kt. 

The low-level center has been moving erratically most of the day, 
but the overall motion seems to be 305/3 kt. There is again little 
change in the track forecast reasoning.  The depression is in light 
steering currents between two mid-level ridges, one to its 
northwest centered over the central U. S. and one to its southeast 
centered near the Bahamas. The U. S. ridge is expected to become a 
little more dominant of a steering feature as it builds eastward.
The guidance is in overall agreement that the cyclone should move 
slowly northwestward to west-northwestward for 36 h or so, followed 
by a turn toward the west. However, there is some spread in the 
guidance in the first 36-48 h about how close the center comes to 
the northern Gulf Coast and how sharp the westward turn would be. 
The new forecast track lies between these two clusters of models and 
is a little to the north of the previous track. It should be noted 
that strong northeasterly shear is forecast over the cyclone, which 
could keep the center south of the forecast track due to the 
effects of convective bursts.  However, there are models such as the 
ECMWF and Canadian that bring the system inland on the northern 
Gulf coast.
 
The depression is experiencing moderate northeasterly shear, and
these conditions should continue for another 18-24 h. It is likely
that there will be convective bursts near and south of the center
during this time, and these should help intensify the cyclone to a
tropical storm. After that, the northeasterly shear should 
increase, and the global models suggest it will get strong enough to 
destroy the vertical integrity of the cyclone. This should halt 
intensification and then cause weakening. The new intensity 
forecast calls for a peak intensity of 45 kt in 36 h, and this is at 
the upper edge of the intensity guidance.  The new forecast also 
calls for the system to weaken to a remnant low by 120 h, and based 
on the dynamical model guidance there is a possibility it 
could dissipate between 72-120 h due to shear and land interaction.
 
It should be noted that the aforementioned shear is likely to give
the cyclone a very asymmetric structure, with the bulk of the
rainfall and much of the wind expected to occur to the south of the
center.
 
 
Key Messages:
 
1. The depression is expected to gradually strengthen and could
bring tropical storm conditions to portions of the Gulf Coast from
the Florida Panhandle westward to southeastern Louisiana Tuesday 
and Wednesday.
 
2. A Storm Surge Watch is in effect for the Alabama, Mississippi,
and southeastern Louisiana coasts, where a life-threatening storm
surge is possible.
 
3. Interests elsewhere in Louisiana and Texas should monitor the
progress of this system, as additional watches could be required for
portions of that area tonight or Tuesday.
 
4. Areas of flash flooding will be possible through Friday along the 
Gulf Coast and adjacent inland locations from western Florida north 
of Fort Myers to the Middle Texas Coast, including southern portions 
of Alabama, Mississippi, and Louisiana.
 
 
FORECAST POSITIONS AND MAX WINDS
 
INIT  20/2100Z 28.7N  85.8W   30 KT  35 MPH
 12H  21/0600Z 29.0N  86.2W   35 KT  40 MPH
 24H  21/1800Z 29.3N  86.7W   40 KT  45 MPH
 36H  22/0600Z 29.6N  87.5W   45 KT  50 MPH
 48H  22/1800Z 29.6N  88.5W   40 KT  45 MPH
 60H  23/0600Z 29.6N  89.8W   35 KT  40 MPH...INLAND
 72H  23/1800Z 29.5N  91.1W   30 KT  35 MPH...INLAND
 96H  24/1800Z 29.5N  93.9W   25 KT  30 MPH...OVER WATER
120H  25/1800Z 29.4N  96.5W   20 KT  25 MPH...POST-TROP/INLAND
 
$$
Forecaster Beven

Posted on 20 July 2026 | 3:48 pm

Tropical Depression Two Wind Speed Probabilities Number 6

Issued at 2100 UTC MON JUL 20 2026

211 
FONT12 KNHC 202048
PWSAT2
                                                                    
TROPICAL DEPRESSION TWO WIND SPEED PROBABILITIES NUMBER   6         
NWS NATIONAL HURRICANE CENTER MIAMI FL       AL022026               
2100 UTC MON JUL 20 2026                                            
                                                                    
AT 2100Z THE CENTER OF TROPICAL DEPRESSION TWO WAS LOCATED NEAR     
LATITUDE 28.7 NORTH...LONGITUDE 85.8 WEST WITH MAXIMUM SUSTAINED    
WINDS NEAR 30 KTS...35 MPH...55 KM/H.                               
                                                                    
Z INDICATES COORDINATED UNIVERSAL TIME (GREENWICH)                  
   ATLANTIC STANDARD TIME (AST)...SUBTRACT 4 HOURS FROM Z TIME      
   EASTERN  DAYLIGHT TIME (EDT)...SUBTRACT 4 HOURS FROM Z TIME      
   CENTRAL  DAYLIGHT TIME (CDT)...SUBTRACT 5 HOURS FROM Z TIME      
                                                                    
WIND SPEED PROBABILITY TABLE FOR SPECIFIC LOCATIONS                 
                                                                    
CHANCES OF SUSTAINED (1-MINUTE AVERAGE) WIND SPEEDS OF AT LEAST     
   ...34 KT (39 MPH... 63 KM/H)...                                  
   ...50 KT (58 MPH... 93 KM/H)...                                  
   ...64 KT (74 MPH...119 KM/H)...                                  
FOR LOCATIONS AND TIME PERIODS DURING THE NEXT 5 DAYS               
                                                                    
PROBABILITIES FOR LOCATIONS ARE GIVEN AS OP(CP) WHERE               
    OP  IS THE PROBABILITY OF THE EVENT BEGINNING DURING            
        AN INDIVIDUAL TIME PERIOD (ONSET PROBABILITY)               
   (CP) IS THE PROBABILITY OF THE EVENT OCCURRING BETWEEN           
        18Z MON AND THE FORECAST HOUR (CUMULATIVE PROBABILITY)      
                                                                    
PROBABILITIES ARE GIVEN IN PERCENT                                  
X INDICATES PROBABILITIES LESS THAN 1 PERCENT                       
PROBABILITIES FOR 34 KT AND 50 KT ARE SHOWN AT A GIVEN LOCATION WHEN
THE 5-DAY CUMULATIVE PROBABILITY IS AT LEAST 3 PERCENT.             
PROBABILITIES FOR 34...50...64 KT SHOWN WHEN THE 5-DAY              
64-KT CUMULATIVE PROBABILITY IS AT LEAST 1 PERCENT.                 
                                                                    
                                                                    
  - - - - WIND SPEED PROBABILITIES FOR SELECTED LOCATIONS - - - -   
                                                                    
               FROM    FROM    FROM    FROM    FROM    FROM    FROM 
  TIME       18Z MON 06Z TUE 18Z TUE 06Z WED 18Z WED 18Z THU 18Z FRI
PERIODS         TO      TO      TO      TO      TO      TO      TO  
             06Z TUE 18Z TUE 06Z WED 18Z WED 18Z THU 18Z FRI 18Z SAT
                                                                    
FORECAST HOUR    (12)   (24)    (36)    (48)    (72)    (96)   (120)
- - - - - - - - - - - - - - - - - - - - - - - - - - - - - - - - - - 
LOCATION       KT                                                   
                                                                    
APALACHICOLA   34  3   3( 6)   2( 8)   1( 9)   X( 9)   X( 9)   X( 9)
 
GFAM 290N 850W 34 10   4(14)   1(15)   X(15)   1(16)   X(16)   X(16)
 
PANAMA CITY FL 34  4   8(12)   4(16)   X(16)   X(16)   X(16)   1(17)
 
DESTIN EXEC AP 34  X   2( 2)   2( 4)   1( 5)   X( 5)   X( 5)   X( 5)
 
WHITING FLD FL 34  X   X( X)   3( 3)   1( 4)   X( 4)   X( 4)   X( 4)
 
PENSACOLA FL   34  X   1( 1)   5( 6)   1( 7)   X( 7)   X( 7)   X( 7)
 
GFAM 290N 870W 34 22  27(49)  10(59)   1(60)   X(60)   X(60)   X(60)
GFAM 290N 870W 50  1   4( 5)   4( 9)   1(10)   X(10)   X(10)   X(10)
GFAM 290N 870W 64  X   X( X)   1( 1)   X( 1)   X( 1)   X( 1)   X( 1)
 
MOBILE AL      34  X   X( X)   3( 3)   2( 5)   1( 6)   X( 6)   X( 6)
 
GULFPORT MS    34  X   X( X)   2( 2)   3( 5)   3( 8)   X( 8)   X( 8)
 
STENNIS MS     34  X   X( X)   1( 1)   2( 3)   4( 7)   X( 7)   X( 7)
 
BURAS LA       34  X   X( X)   1( 1)   6( 7)   5(12)   X(12)   X(12)
 
GFAM 280N 890W 34  X   1( 1)   4( 5)   7(12)   4(16)   X(16)   X(16)
 
NEW ORLEANS LA 34  X   X( X)   X( X)   1( 1)   5( 6)   1( 7)   X( 7)
 
HOUMA LA       34  X   X( X)   X( X)   1( 1)   5( 6)   1( 7)   X( 7)
 
GFAM 280N 910W 34  X   X( X)   1( 1)   1( 2)   7( 9)   1(10)   X(10)
 
BATON ROUGE LA 34  X   X( X)   X( X)   X( X)   3( 3)   1( 4)   X( 4)
 
MORGAN CITY LA 34  X   X( X)   X( X)   X( X)   4( 4)   1( 5)   X( 5)
 
LAFAYETTE LA   34  X   X( X)   X( X)   X( X)   2( 2)   1( 3)   1( 4)
 
NEW IBERIA LA  34  X   X( X)   X( X)   X( X)   3( 3)   1( 4)   X( 4)
 
GFAM 280N 930W 34  X   X( X)   X( X)   X( X)   2( 2)   3( 5)   X( 5)
 
LAKE CHARLES   34  X   X( X)   X( X)   X( X)   1( 1)   1( 2)   1( 3)
 
CAMERON LA     34  X   X( X)   X( X)   X( X)   4( 4)   6(10)   X(10)
 
KOUNTZE TX     34  X   X( X)   X( X)   X( X)   X( X)   2( 2)   1( 3)
 
GALVESTON TX   34  X   X( X)   X( X)   X( X)   1( 1)   4( 5)   X( 5)
 
GFAM 280N 950W 34  X   X( X)   X( X)   X( X)   X( X)   2( 2)   1( 3)
 
HIGH ISLAND TX 34  X   X( X)   X( X)   X( X)   X( X)   2( 2)   1( 3)
 
MATAGORDA TX   34  X   X( X)   X( X)   X( X)   X( X)   2( 2)   1( 3)
 
$$                                                                  
FORECASTER BEVEN

Posted on 20 July 2026 | 3:48 pm

Tropical Depression Two Forecast Advisory Number 6

Issued at 2100 UTC MON JUL 20 2026

111 
WTNT22 KNHC 202047
TCMAT2
 
TROPICAL DEPRESSION TWO FORECAST/ADVISORY NUMBER   6
NWS NATIONAL HURRICANE CENTER MIAMI FL       AL022026
2100 UTC MON JUL 20 2026
 
TROPICAL DEPRESSION CENTER LOCATED NEAR 28.7N  85.8W AT 20/2100Z
POSITION ACCURATE WITHIN  30 NM
 
PRESENT MOVEMENT TOWARD THE NORTHWEST OR 305 DEGREES AT   3 KT
 
ESTIMATED MINIMUM CENTRAL PRESSURE 1005 MB
MAX SUSTAINED WINDS  30 KT WITH GUSTS TO  40 KT.
WINDS AND SEAS VARY GREATLY IN EACH QUADRANT.  RADII IN NAUTICAL
MILES ARE THE LARGEST RADII EXPECTED ANYWHERE IN THAT QUADRANT.
 
REPEAT...CENTER LOCATED NEAR 28.7N  85.8W AT 20/2100Z
AT 20/1800Z CENTER WAS LOCATED NEAR 28.7N  85.7W
 
FORECAST VALID 21/0600Z 29.0N  86.2W
MAX WIND  35 KT...GUSTS  45 KT.
34 KT... 40NE  50SE   0SW   0NW.
 
FORECAST VALID 21/1800Z 29.3N  86.7W
MAX WIND  40 KT...GUSTS  50 KT.
34 KT... 50NE  50SE  40SW   0NW.
 
FORECAST VALID 22/0600Z 29.6N  87.5W
MAX WIND  45 KT...GUSTS  55 KT.
34 KT... 50NE  70SE  60SW  40NW.
 
FORECAST VALID 22/1800Z 29.6N  88.5W
MAX WIND  40 KT...GUSTS  50 KT.
34 KT... 50NE  70SE  60SW  50NW.
 
FORECAST VALID 23/0600Z 29.6N  89.8W...INLAND
MAX WIND  35 KT...GUSTS  45 KT.
34 KT... 40NE  60SE  60SW   0NW.
 
FORECAST VALID 23/1800Z 29.5N  91.1W...INLAND
MAX WIND  30 KT...GUSTS  40 KT.
 
EXTENDED OUTLOOK. NOTE...ERRORS FOR TRACK HAVE AVERAGED NEAR 125 NM
ON DAY 4 AND 175 NM ON DAY 5...AND FOR INTENSITY NEAR 15 KT EACH DAY
 
OUTLOOK VALID 24/1800Z 29.5N  93.9W...OVER WATER
MAX WIND  25 KT...GUSTS  35 KT.
 
OUTLOOK VALID 25/1800Z 29.4N  96.5W...POST-TROP/INLAND
MAX WIND  20 KT...GUSTS  30 KT.
 
REQUEST FOR 3 HOURLY SHIP REPORTS WITHIN 300 MILES OF 28.7N  85.8W
 
INTERMEDIATE PUBLIC ADVISORY...WTNT32 KNHC/MIATCPAT2...AT 21/0000Z
 
NEXT ADVISORY AT 21/0300Z
 
$$
FORECASTER BEVEN

Posted on 20 July 2026 | 3:47 pm

|Weather Page Top|


Abaco Weather
Abaco Weather